Low-cost turbidity probe | Analog-to-digital converter
The continuous and excessive water use due to the developing industry and agricultural activities creates a strong pressure on water resources, leaving the aquatic ecosystem vulnerable to large-scale degradation. Water resources management and protection are at the core of sustainable development, and require constant monitoring and assessing, being a key element to minimizing the negative impacts on these ecosystems. One of the most important indicators of water quality is the relative cloudiness of water caused by chemical precipitates, organic and inorganic compounds, and microorganisms (Fang et al., 2018; Sci. Total Environ.).

Although the increase of turbidity causes a reduction in water visibility, the effect on water quality is not limited to water cloudiness. Suspended particles present can serve as a refuge for pathogens, heavy metals, and pesticides, and for that reason, turbidity is one of the most important parameters to describe water quality.
Turbidity meters work based on optical scatters and transmit-detection techniques (Sadar, 1998; Turbidity Science). The light emitted by the light source is absorbed, reflected, and dispersed by suspended particles present in the water. The light detectors, mounted at different angles from the light source, are responsible to capture the light and correlate it with the amount of suspended particles present in the water sample (Fig 2).
For example, if the light detector is positioned at 90° from the light source (Cneph), the cell will have a higher light response under higher turbidity waters (this is known as the nephelometry principle). On the other hand, if the detector is positioned aligned with the light source (Cturb), the cell will detect higher light intensity for lower water turbidity values, since most part of the light will not be scattered by suspended particles.
Commercial turbidimeters that perform continuous turbidity monitoring cost around 7000 Euros. Due to the high cost of commercial turbidity sensors, recently many low-cost turbidity meters have been proposed (Rocher et al., 2021; Sensors and Gillett and Marchiori, 2019; Sensors). The aim of this pair of studies is to describe the design and fabrication of a low-cost smart turbidity meters, capable to measure and deliver in real-time water turbidity measurements to web pages. In addition, as this section is devolted to developed analog turbidity sensors, the aim of this study is also understand how ADC (Analog-to-digital converter) resolution can influence turbidity readings, conbsidering accuracy, precision, and resolution. In the end of this study we also compare results from the analog sensor to digital sensors. To know more about digital light-to-frequyency converter sensors, click here.
First tests: A first attempt

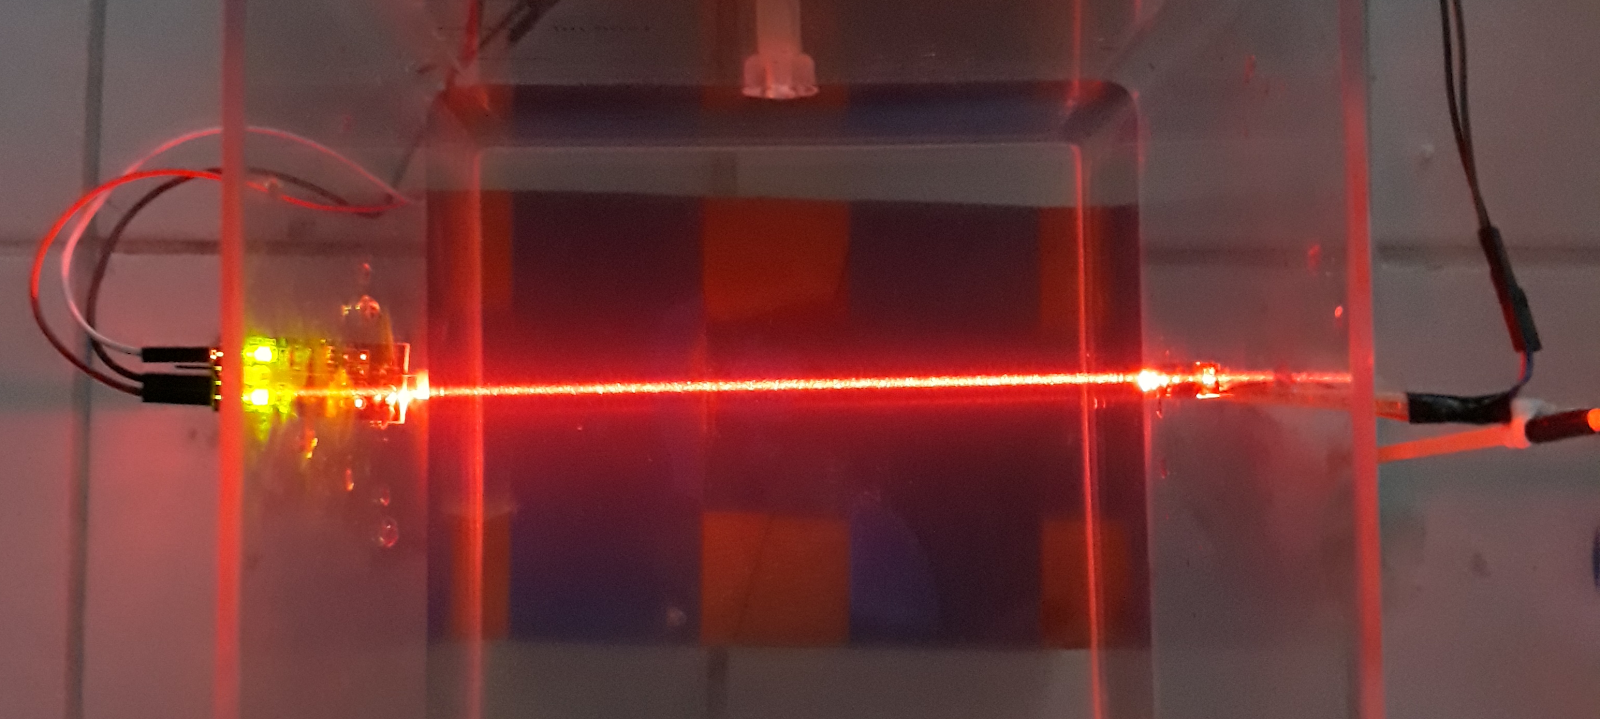
The first-attempt device was composed of a LASER (as the light source) and a light-dependent resistor (LDR), as the light detector (Fig 3). The first prototype was conducted only to investigate if a simple set-up based on optical scatters and transmit-detection techniques could be used to investigate water turbidity. First we investigated three preliminar points:
- Investigate the influence of the position of the light detector cells (Cneph Vs Cturb);
- Investigate the influence of the internal resistance of the LDR;
- Investigate the influence of the external light on the turbidity measurements.

During the calibration phase, turbidity standard solution was injected into the analyzed area (solução from Fig. 3). After homogenization, the value from the analog-to-digital converter pin was recorded and compared to the water turbidity measured by a DLT-WV digital turbidity meter (Fig. 4). To measure the water turbidity a water sample was collected from the solution (solução). This step was repeated several times, increasing the concentration of turbidity solution inside the analyzed area. Please have in mind that this is only a blog, our intention is not describe rigorously every step, but share the main idea. For more detailed information, contact us or read our papers.
The variation of the internal resistance did not vary the sensitivity of reading from different turbidity ranges (this is not illustrated in Fig 4). We observed a proportional influence for the whole range o turbidity, indicating that the turbidity change is not affected by the change of LDR resistance. We suggested that since it operates with voltages much higher than 1 V and much lower than 5 V (observe that the x-axis is far from 0 and 1024), the sensitivity does not influence strongly the readings.
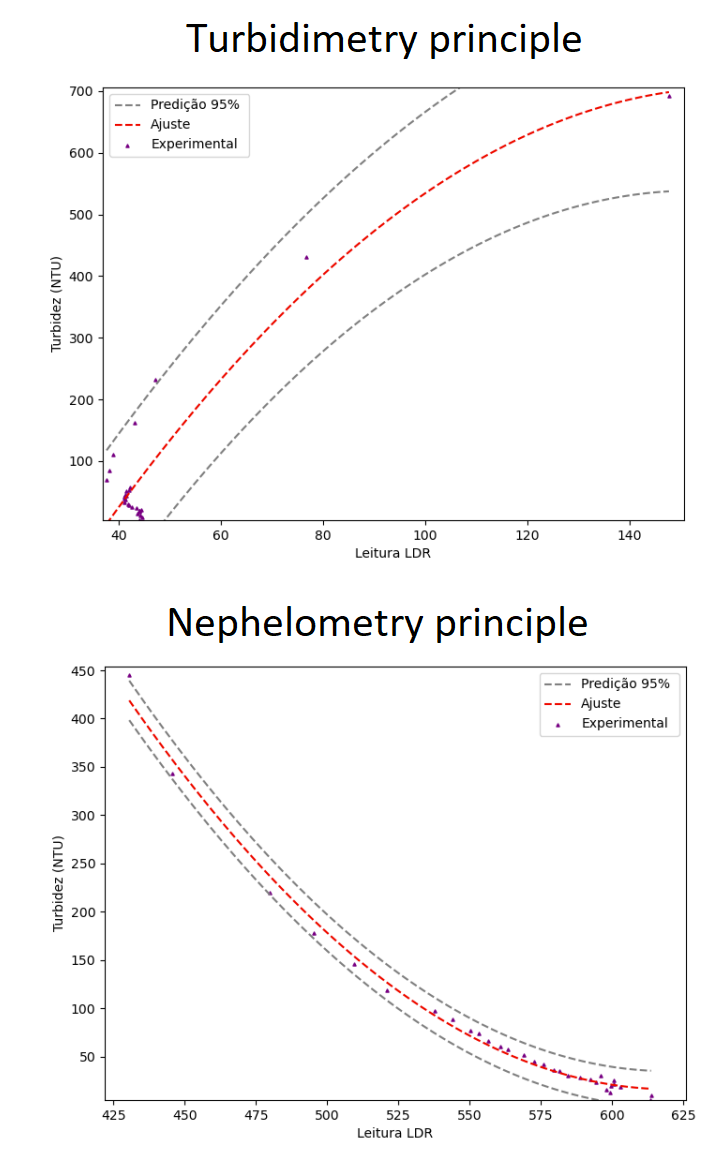
We observed that when the light source is aligned to the light detector, low turbidity values present higher error compared to data measured under the nephelometry principle. We identify that this behavior occurs especially due to the light source. The incoming LASER beam, which generates highly collimated and intense light, saturates the detector when the presence of suspended particles is relatively low (small water turbidity). This has been observed in the literature, especially for IR LED light sources (Sadar, 1998; Turbidity Science).
In addition, from our results, we observed a strong influence of the external light on turbidity measurements. However, our analysis indicates that if the external light has constant intensity, the variability is proportional to results in the absence of external light for the whole analyzed turbidity range (0 to 160 NTU). This observation allows us to estimate the turbidity under the influence of external light by taking the difference between two measurements (incoming LED light on and off) to reduce the influence of external light.
Before developing the waterproofed version, we tested several designs and light sources. But the most valuable one, that deserve to be mentioned, we called Paris.
Analogic turbidity probe


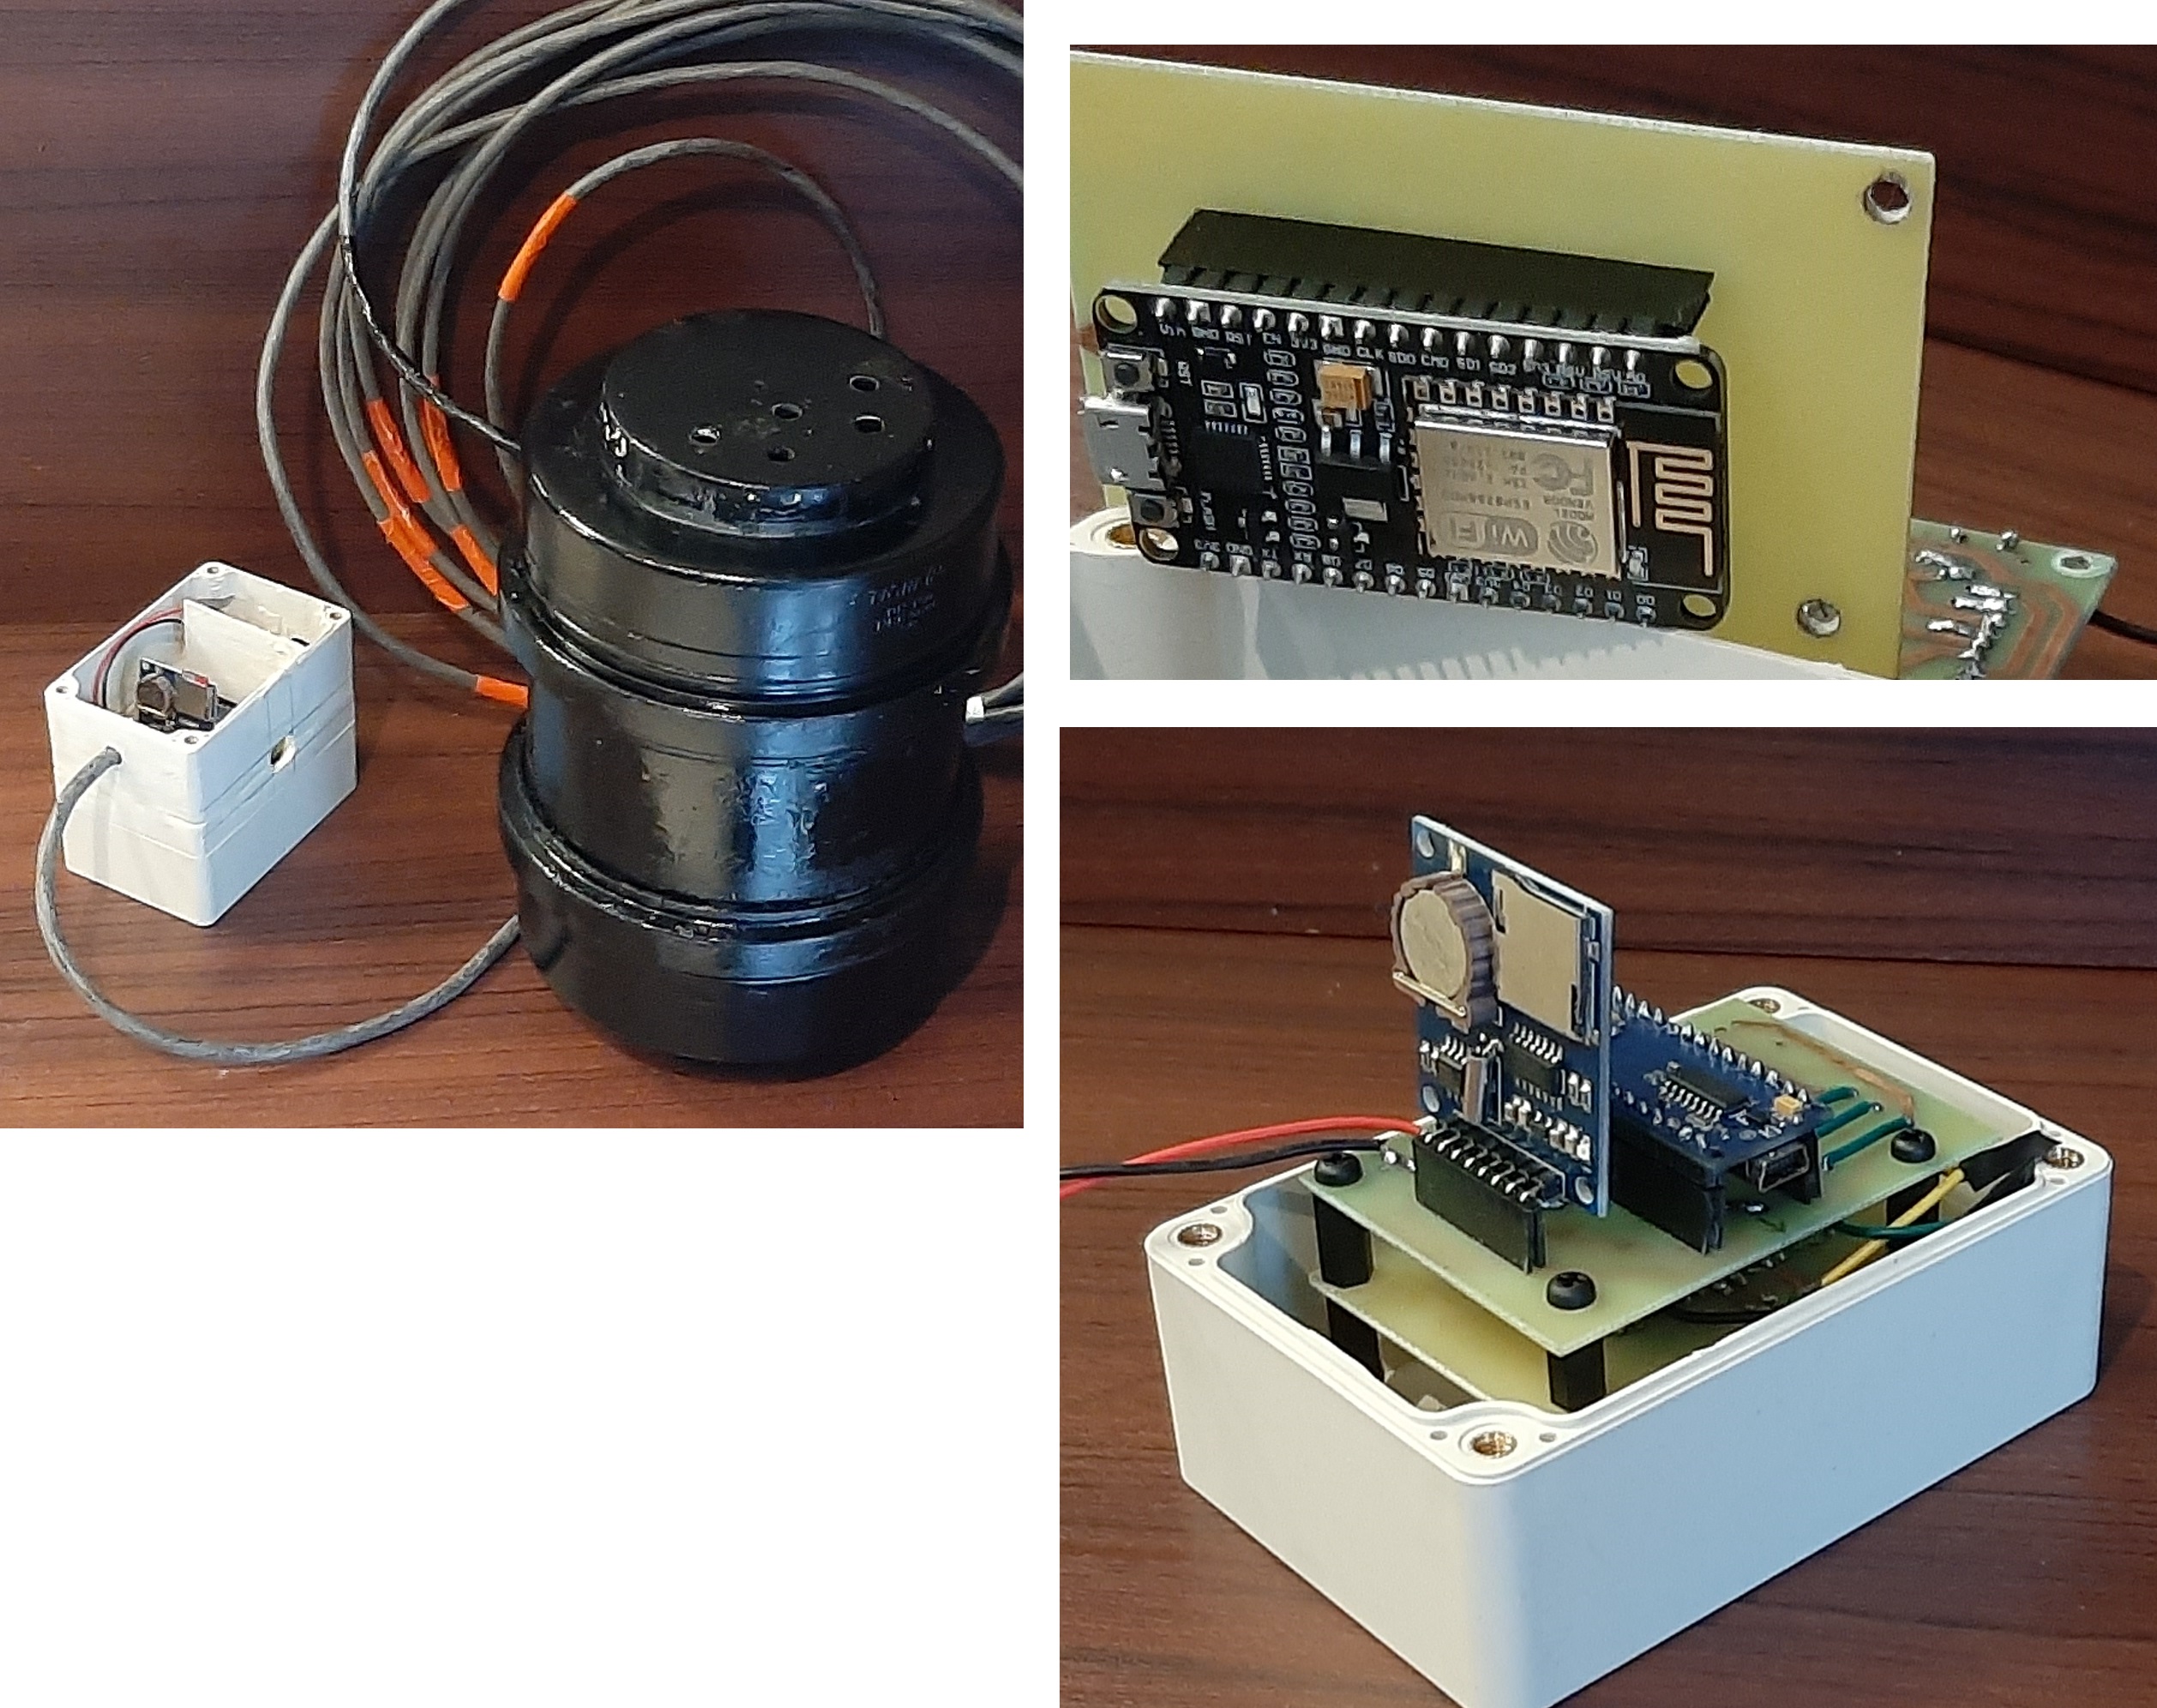
This probe (Fig 5) is a waterproofed turbidity meter and combines one LED RGB as the light source with three LDRs (LDR PGM5537) light detector cells, one positioned at 180° and two at 90° from the light source, mounted in opposite directions (de Carvalho Bueno et al., 2022; XXX CLH).
Note that differently from our first prototype, now the light emitter is a LED RGB. We have tasted a prototype using IR LED, but as we expect to develop a turbidity meter capable to measure turbidity and additional parameters that could be detected through optical technique, we decided to keep all analysis using a LED RGB as a light emitter (Parra, 2018; Aquac. Eng.).
We used an Arduino NANO, which has an ATmega328P microcontroller with an integrated 10-bit ADC. Since light detectors from Paris use ADC transmission, the resolution of the measurements is limited by the ADC resolution. To evaluate how light colors and voltage reference may influence measurements (accuracy, precision, and resolution), we varied incoming light between white, yellow, and blue, and voltage reference between 5 V and 1.1 V. The variation of voltage reference was performed only under blue light, since it has lower light intensity. The eletrical circuit of this probe is illustrated in Fig 6.
The probe housing material is composed of two dark PVC cylinders, one with 10 cm of diameter and another with 15 cm, placed inside to the 10 cm pipe in order to waterproof the sensor. In the end a maze-like pattern was contructed to reduce the interference of external light.
In this first stage, we only investigate the sensor performance by estimating the probe accuracy, precision, and resolution (in lab). All these statystical value has been estimated through a continuous injection of turbidity solution into the probe interior. The results have been compared to results obtained from a bench nephelometer, a DLT-WV digital turbidity meter with precision of 0.1 NTU.
We used different turbidity solution to calibrate the sensor. In this study we used as the standard turbidity solution made with skimmed milk (4,76%) and water (95,24%), presenting turbidity of 668 NTU according to the reference turbidity meter.
This turbidity solution has been used as a substitute to Formazin Turbidity Standard (Garcia and Garcias, 2011; Oceans IEEE and Villamil et al., 2021; Water Sci. Technol.).
First we present results from one single run, and only considering data measured under the turbidimetry principle.


In all the three cases the correlation coefficient for a linear model was close to 1, indicating that independently of the light source and voltage reference applied in the ADC pin, the analog signal presents a satisfactory correlation with turbidity readings.
However, measurements under blue color presented a noticeable increase in the standard deviation (from 1.2 NTU obtained for white and yellow light colors to 19.8 NTU for blue light color), indicating a loss of precision (Fig 7). Thus, even though the low operation voltage allows an increase in measurement resolution from 2.7 NTU (white and yellow) to 0.5 NTU (blue), the analog sensor under blue color presented low precision on the readings. In addition, under blue light, the standard deviation from measurements is strongly dependent of the turbidity level, indicating that precision decreased by 1 NTU with the increase of turbidity from 1 NTU to 25 NTU.
Small variabilities were observed on statistical analysis from measurments under white and yellow light, indicating that both are statistically similar.
Comparing methods (Analogic and digital sensors)

The first developed sensor was based on analogic sensor, which had three LDRs mounted in different locations, one positioned at 180° and two at 90° from the light source. To test light-to-frequency converter and analog sensors based on ADC transmission, we brought into existence the this turbidity probe, similar to last one, but with only two light detectors, both mounted at 90° from the light source. The difference is that one is a LDR, based on ADC transmission, and other is a digital light-to-frequency converter. Differently from the light-dependent resistor (LDR) that is a analog sensor that varies the internal resistance depending on the intensity of the light, the light-to-frequency converter works as a digital sensor capable to convert the light intensity that reaches the photodiodes in a continuous digital square wave, in which the light intensity is proportional to the wavelength.
Firstly, our investigation has been conducted in the lab, injecting standard turbidity solution into the probe interior. The standard turbidity solution was created similar as described before, through a dillution of water and skimmed milk. In next steps we pretend to test both sensor in a real environment, and compare the results of the LDR and the light-to-frequency converter.